Crystal Reports or Microsoft SSRS
Do you have the ability to modify standard system reports using an off the shelf reporting tool?
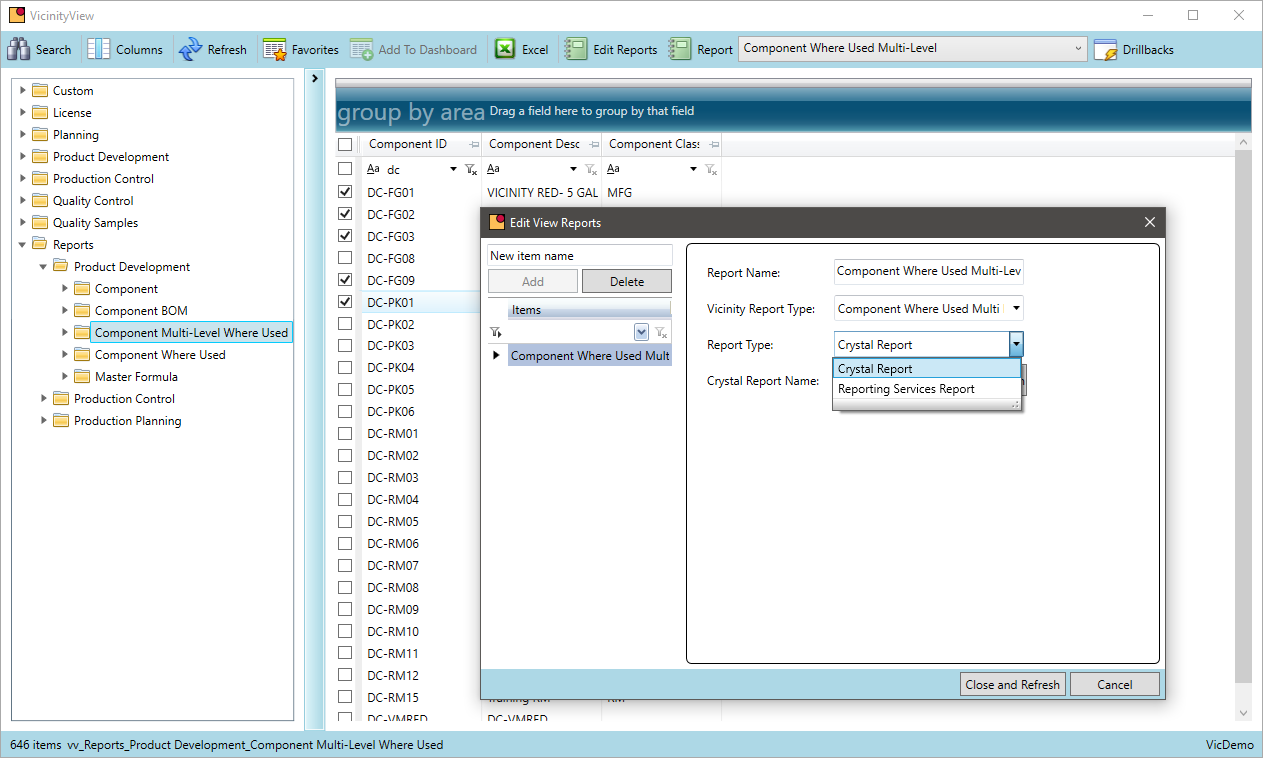
All standard reports in VicinityFood are written with Crystal Reports or Microsoft SSRS. The source reports are delivered with the installation so users can modify these reports as required.
- Leverages industry standard Crystal Reports
- Runtime/free version of Crystal is loaded with VicinityFood – Purchase of a developer version of Crystal is required to make changes to reports
- Microsoft SSRS is installed with every version of SQL – This is a free license and can be used by authorized users
- Vicinity can make changes to reports or members of your organization can make changes
Query Tool - VicinityView
Are there times you just want to query data in the system without having to write a report?
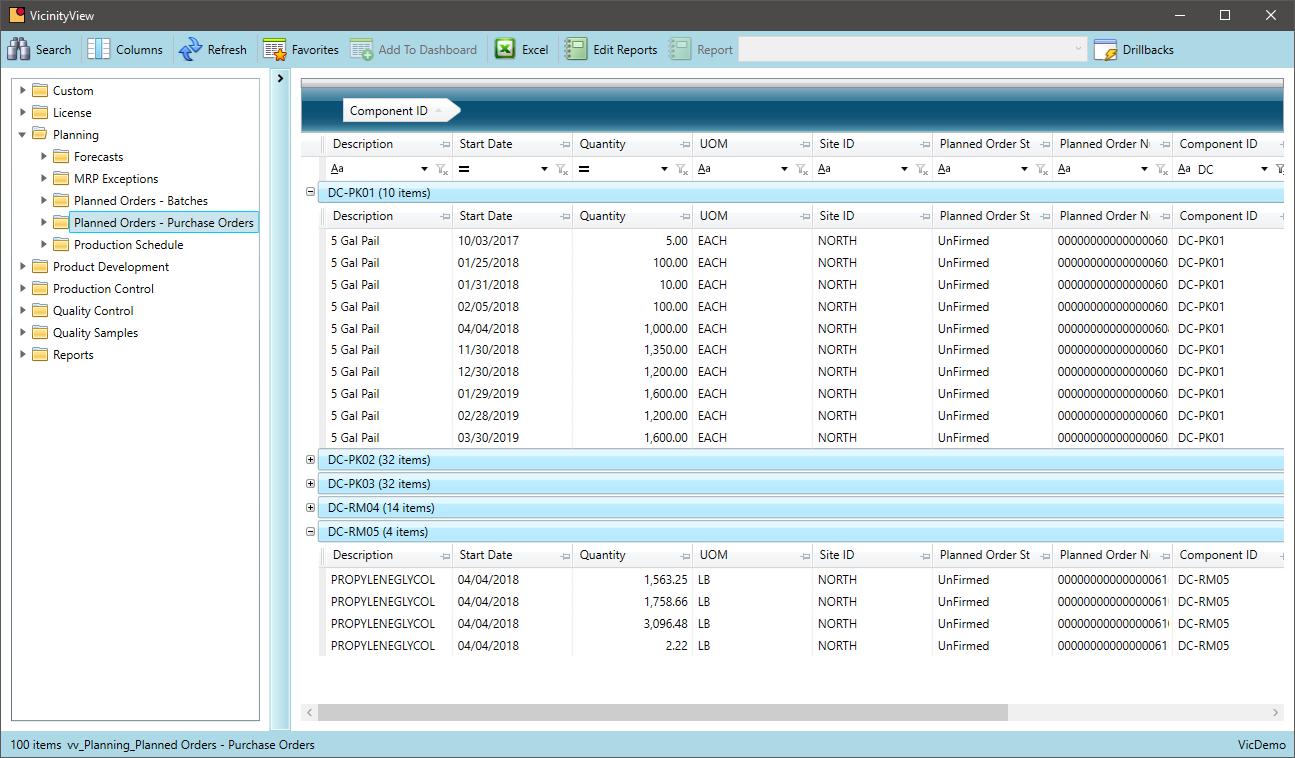
Food manufacturers have many sources of data. Often this data needs to be reviewed. VicinityFood provides a tool to query any data in the system without the need for writing a report or exporting to some other tool. If a quick view of a list of data is what you need VicinityView is your tool.
- Built on user-definable SQL queries
- Access any SQL data in VicinityFood
- Search any field in the query
- Group by any field in the query
- Restrict columns of data and only see that data the user has access to
- Save configuration setting as a favorite and save the favorite to the desktop
- Export any query to excel for further analysis
- Add custom lists of data to the ones that ship with VicinityFood
Access data directly in EXCEL
If you need to access data in excel from your existing system can get that data automatically with an ongoing data refresh? Or is the data in excel static?
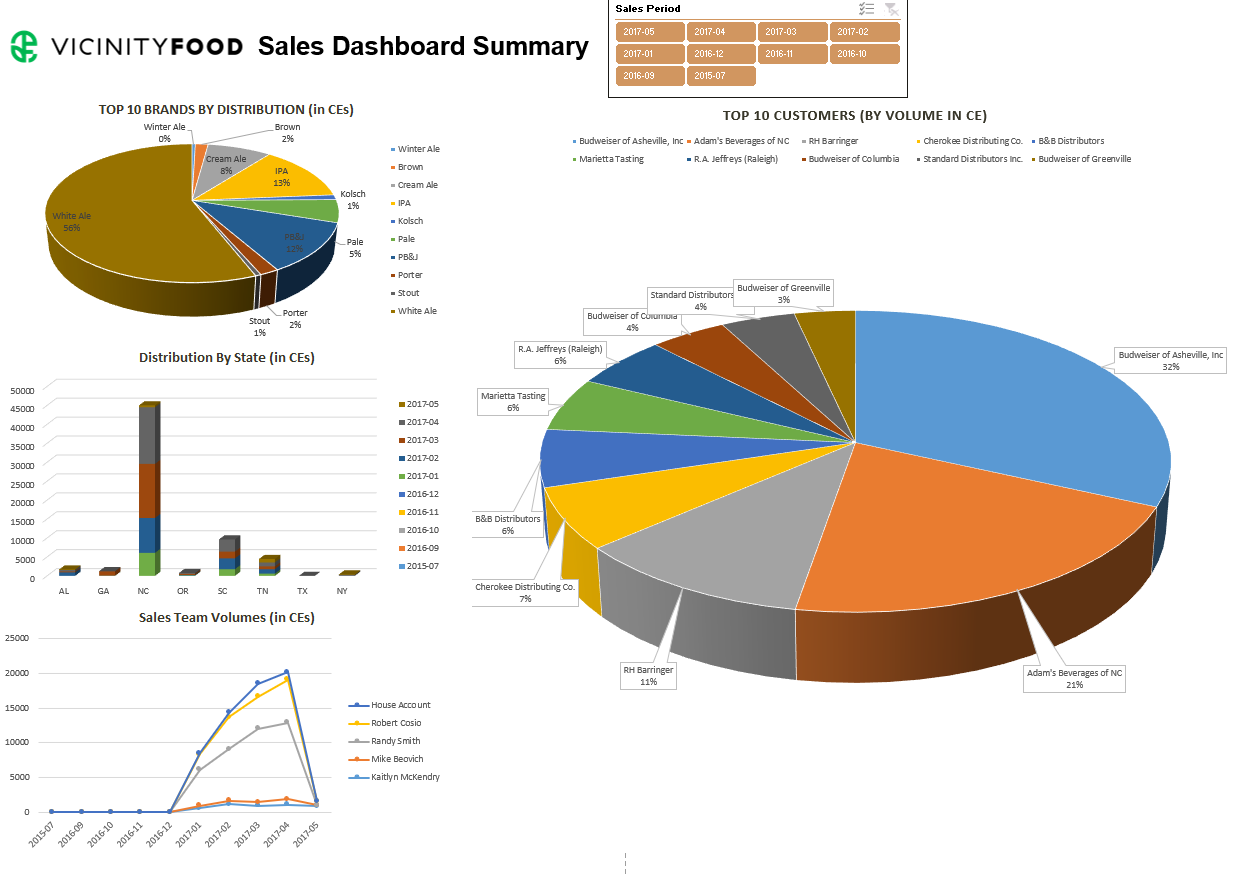
Excel is a powerful tool for food manufacturers. It is on everybody's desktop and everyone can use it. The problem with excel is that often the data is not kept up to date or if it is the process is very manual to do that. VicinityFood allows for automatic updates of Excel data. As soon as the spreadsheet is opened the data is refreshed. This reduced the effort to keep the data in synch, reduces the likelihood of error and makes the data more timely.
- Use Excel to perform unique custom queries
- Build custom dashboards in Excel
- Link the spreadsheet to VicinityFood to receive automatic updates of the data
Office 365 - Power BI
Is your current data accessible to remote users or those who would prefer to use a browser to analyze business data?
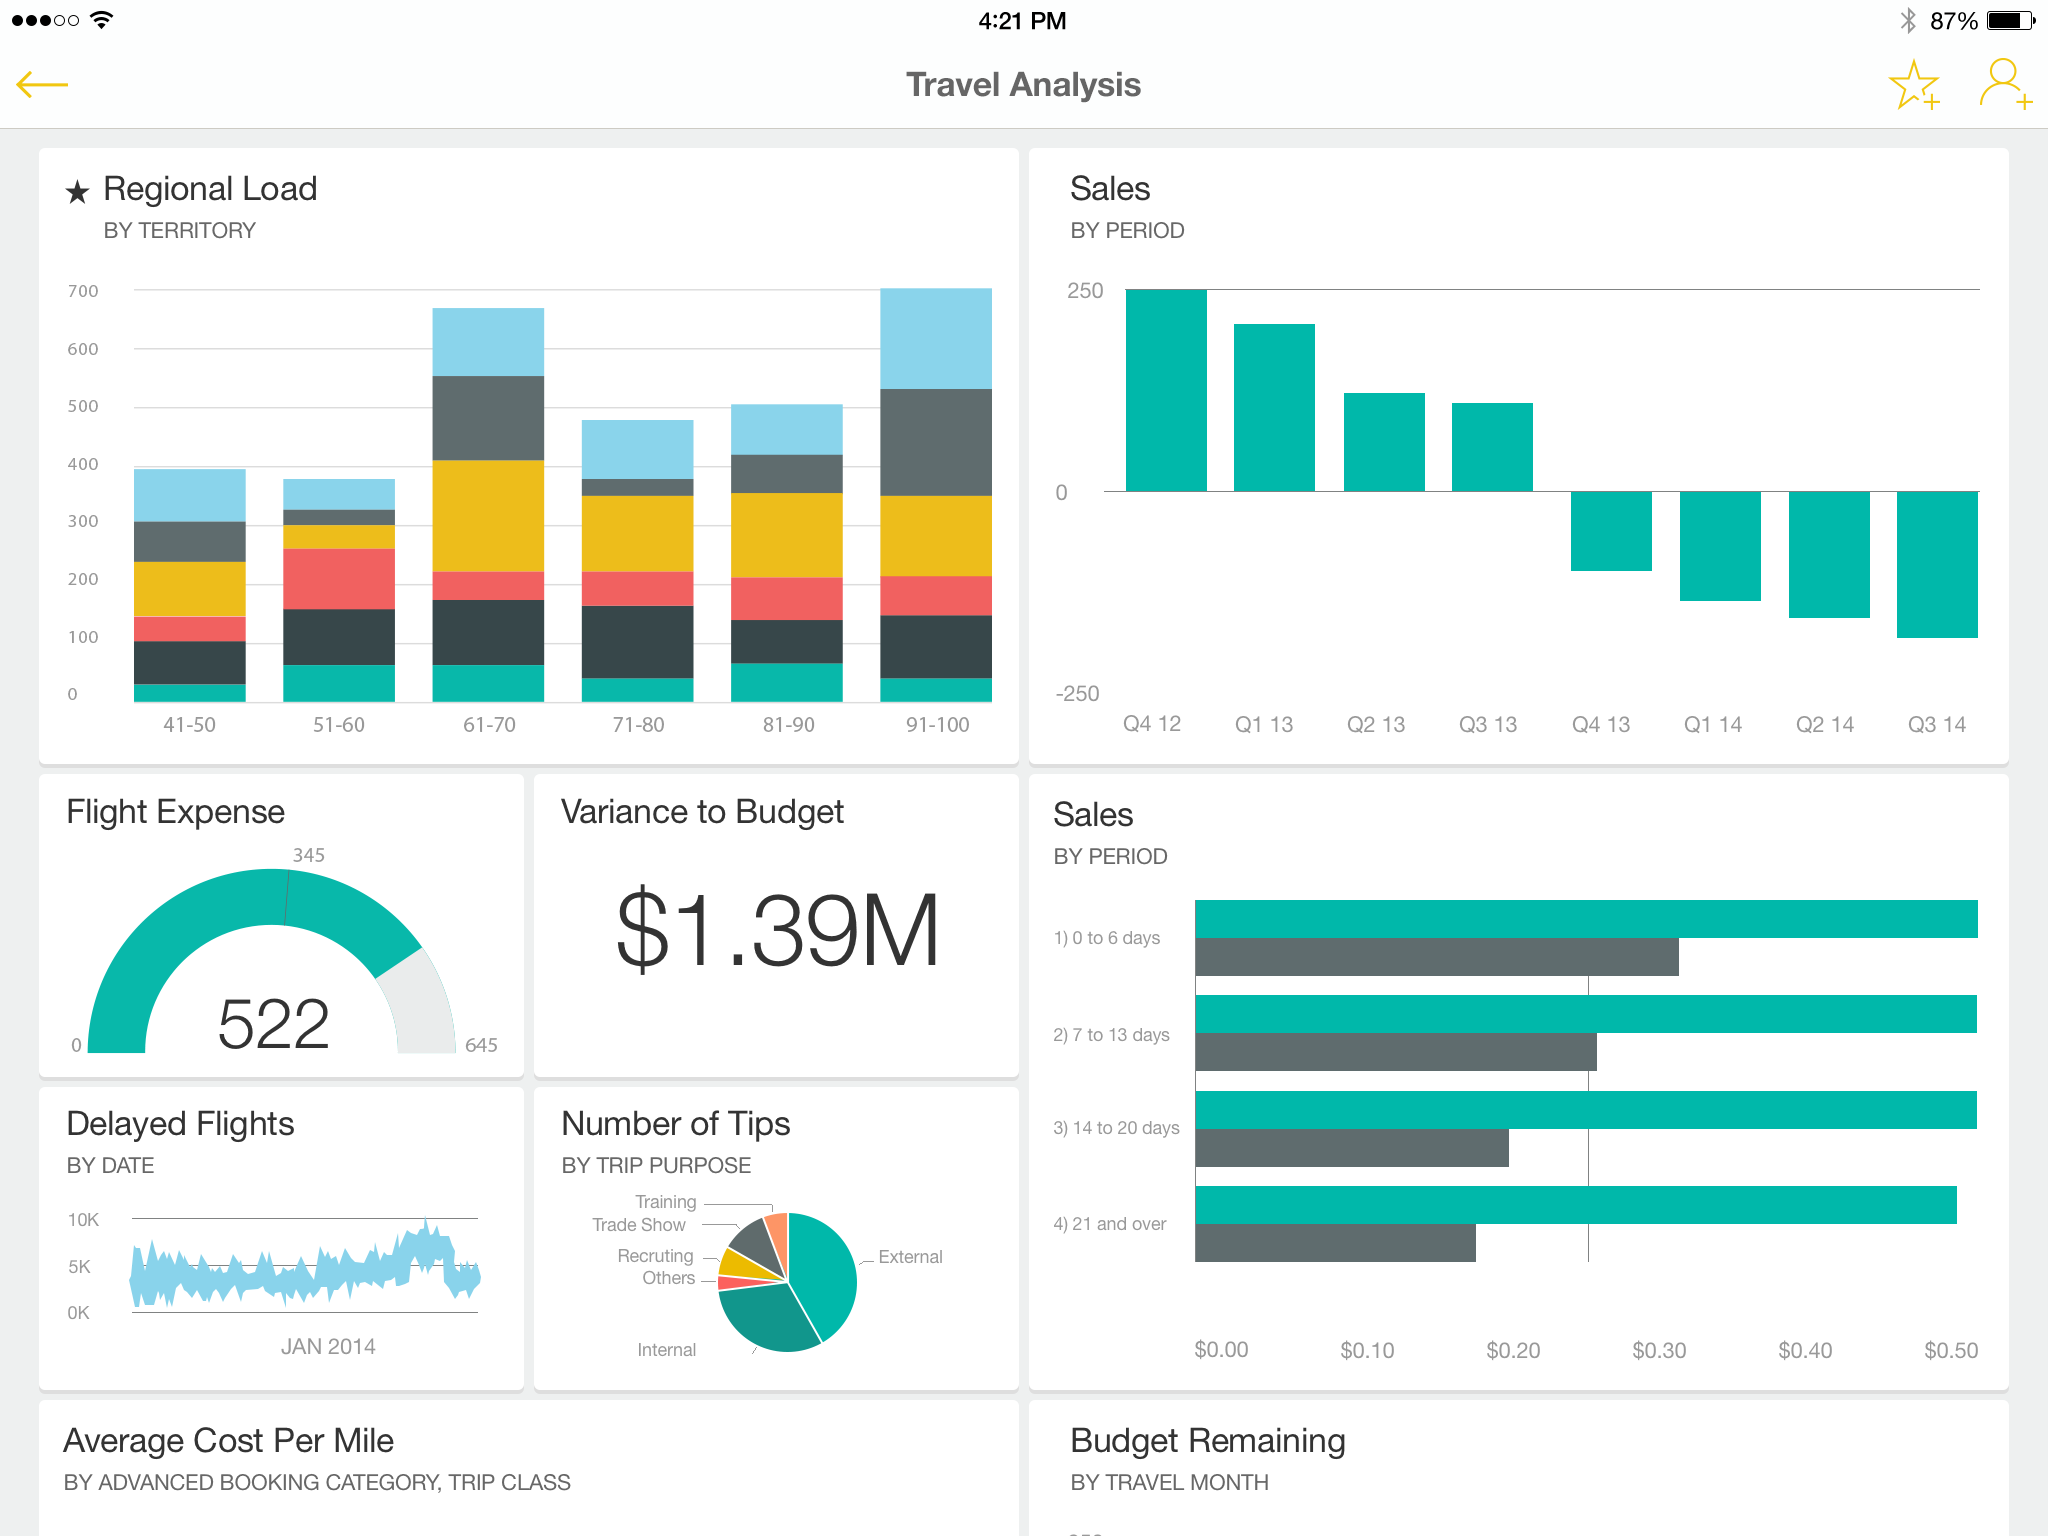
Food manufacturers have a diverse group of users. Some travel extensively or do not have access to the central database on a regular basis. Other users are more comfortable reviewing data via standard dashboards providing specific views into data that is relevant to them. VicinityFood has made its data accessible to Power BI. This is a browser-based dashboard presentation tool that makes access to dashboard data simple and intuitive.
- Build dashboards in Excel
- Publish dashboards in Power BI so users can access the data via a browser
- Data is automatically updated to the Power BI cloud with no user interaction
Available Reports
Vicinity offers a number of out of the box reports to meet your production needs. In addition, our consulting staff can help format and produce your custom reporting needs as necessary.
Back-Ordered Summary Report
- Review ordered products by distributor and by date
Component Cost Roll Up Report
- View a complete BOM breakdown of the unit cost identifying each element consumed in an individual finished good item
Dashboard views
- Connect data to dynamic dashboard views via excel or Power B
Dynamic Grid Report
- Utilize the query and save view, with the ability print or export to excel
Estimation and Ordering by Customer Report
- View a full report that summarizes future shipments by day by customer
Invoices by Finished Good Item Report
- Measure your forecasting efforts summary report tallying invoices by product and distributor for the MTD period
Lot Trace Report
- Determine where a raw material lot was consumed and fast-track a recall process if needed
Proposed Cost Report
- Review scenario based impacts of certain price changes on overall production cost
Where Used Report
- Identify all batches associated with a component or raw material item
Out of Spec QC Summary Report
- Identify QC test results outside of target parameters for a given set of test(s) or batches over time
Query Summary Report
- View month to date of overall sales, finished goods sold by channel, and sales by style or brand


